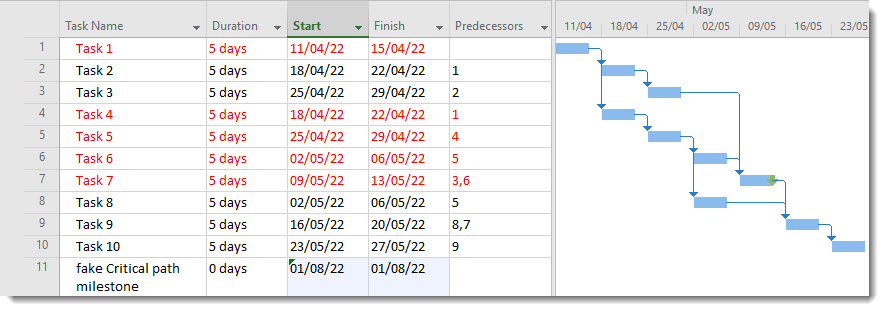
The example below is a straightforward plan, and it is easy to see what is driving any of the tasks to their dates. However, when the plan is long or complex, it can be hard work to know why a task is where it is.

There are several ways to work out what drives any given task to a specific date, including:
- Inspection tool
- Gantt formatting
- Temporary Critical Path
Inspection tool.
To display a pane that shows what is driving any selected task, click on the Inspect button in the Tasks section of the Tasks ribbon. This displays the Inspector Pane to the left of the plan.

This pane gives you details about what is driving your task. In this instance, it is “Task 6”. You can click on the driving item to jump to that task. The Inspector pane will then show what is driving that task. You can use this to move up and down the task chain to understand the driving task chain. Whilst the Inspector pane allows you to jump up and down the plan, you can no longer jump down to your original task if you click elsewhere, for instance, to open one of the tasks. For this reason, it is helpful to make a mental note and then use F5 to jump back to your original task.
If a constraint drives your task, this can be seen in the Inspector Pane:

For further information on the Inspector Pane, see Microsoft’s help page
Gantt formatting
By clicking on the Gantt Format menu and then the Task Path button in the Bar Styles section, you can highlight the whole task chain driving the task. You can also see the tasks driven by the task of interest.

The formatting highlights all the items in the plan driving the task. If you choose, it can also show the tasks that the task is driving. The formatting allows you to see the task path. Gantt formatting lets you see the task chain as you scroll up and down the plan.

The other options would allow you to see all tasks linked to or from the current task. This doesn’t let you see the driven / driven tasks as clearly; however, it can be handy when working out what will change if you move a task out. This can be very useful when investigating what happens if a key milestone / dependency moves.
Temporary critical path.
If you set the deadline for the task to match the finish date, the Total Slack for the task and the driving task chain becomes zero. If you have formatted the text to show critical items as red, the driving task chain is shown in red
To set this formatting, click Text Styles in the Format section of the Bgatt Chart format ribbon and select “Critical Tasks” from the “Item to change” drop-down.

Double-click on the task and set the Deadline in the Advanced section to set the deadline to match the finish date.

You can also display the deadline column and copy the finish date into this cell.
As “Task 7” is on the overall critical path leading to the last item in the schedule, this also displays the onward chain.

I usually insert a “Fake critical path” milestone in the far future to eliminate this. This means that MS Project only uses the deadlines that I chose to determine the overall critical path.

Note if this becomes the only critical path, then you can use the inbuild Critical filter to filter the plan to show the task path
